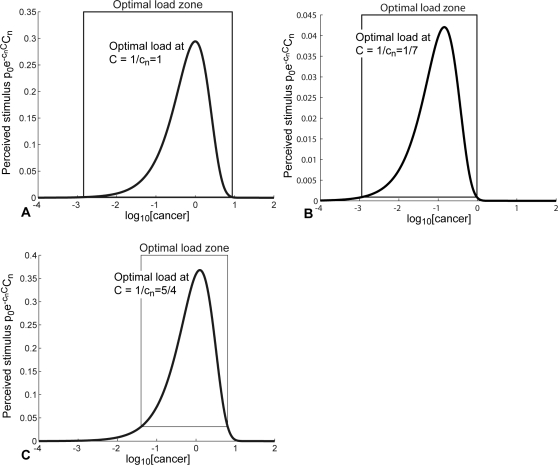
Figure 5. Stimulation levels of anti-leukemia T cells versus logs of the cancer concentrations.
Optimal loads are the cancer concentrations C for which the perceived stimulus,  , is maximized. Optimal load zones are the range of leukemic concentrations where the T cell stimulation rate is faster than the T cell death rate, i.e.
  . (A) P1. (B) P4. (C) P12.

