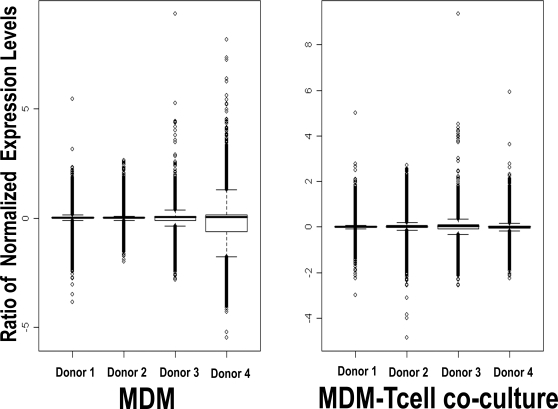
Figure 1. BoxPlot of Ratios [Infected:Uninfected] of gcRMA-transformed microarray expression data.
The value of the log2(Infected expression value ÷ Uninfected expression value) for each probe set in both the MDM only condition and the MDM-T cell co-culture was calculated and plotted separately for each donor. The central box represents the interquartile range and the solid black bar represents the median probe set. Downstream analyses were performed using all four donor data sets.

