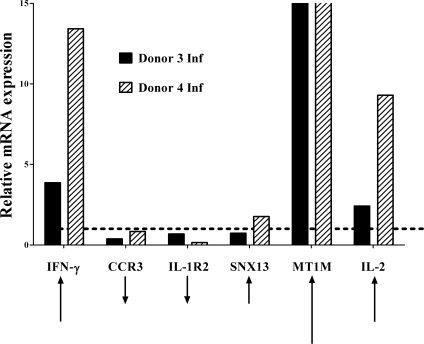
Figure 2. Validation of microarray data with TaqMan RT-PCR of selected differentially expressed genes.
RNA was extracted from human MDM-T cell co-cultures 4 hours after the addition of T-cells to infected or uninfected macrophages (28 total hours of L. chagasi infection). The relative expression of genes in infected compared to uninfected levels, in two separate donors, was examined using TaqMan RT-PCR. Six genes identified to be differentially expressed in the primary microarray analysis were selected for validation. Relative expression of infected samples is displayed in reference to a line at y = 1, signifying no change. Bars below y = 1 signify genes that have decreased expression relative to uninfected samples. The black arrows at the bottom indicate the relative magnitude and direction of change anticipated from the microarray data.

