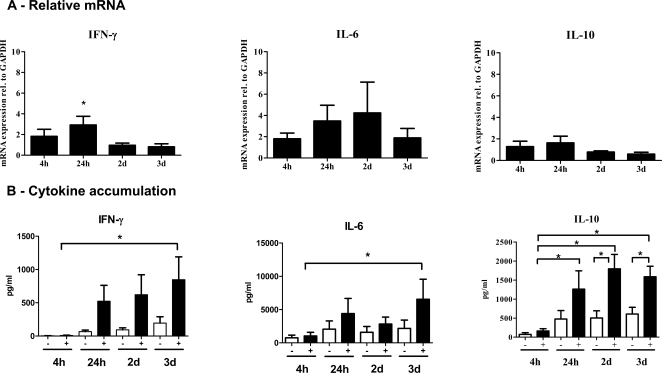
Figure 3. RT-PCR and cytokine assays of IFN-γ, IL-6 and IL-10 in MDM-T-cell co-cultures.
MDMs were infected with L. chagasi for 24 hours, and autologous Leishmania-naïve T-cells were added for the indicated times. (A) Gene expression was examined comparing RNA harvested at the same time point from infected versus uninfected co-cultures. All mRNA levels were normalized to GAPDH. (B) Supernatants were collected after the indicated times of co-culture from uninfected (−) versus infected (+) MDM-T cell co-cultures. Cytokine concentrations were measured using Lincoplex (Millipore) cytokine beads. Standard curves were generated using standards provided by the company. Data for relative mRNA levels or cytokine concentrations represent the mean±SEM of three independent infection experiments from different human donors. * = p<0.05. Statistical analysis was performed using (A) 1-way ANOVA and Tukey's Multiple Comparison Test or a (B) 2-way ANOVA test, respectively.

