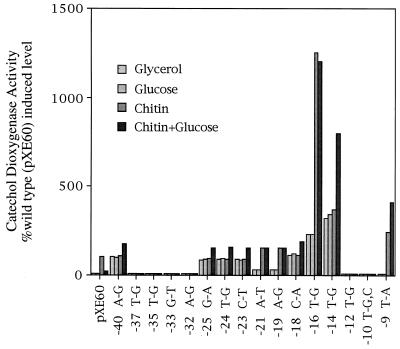
Figure 2.
Analysis of point mutations in the chi63 promoter region. This histogram shows the results of catechol dioxygenase assays plotted as a percentage of fully induced wild type from S. lividans containing plasmids with chi63-xylE transcriptional fusions. Promoter mutations are labeled as to the position upstream of the transcription start site and the base change observed. Each plasmid-containing strain was assayed after growth on the carbon source indicated.

