
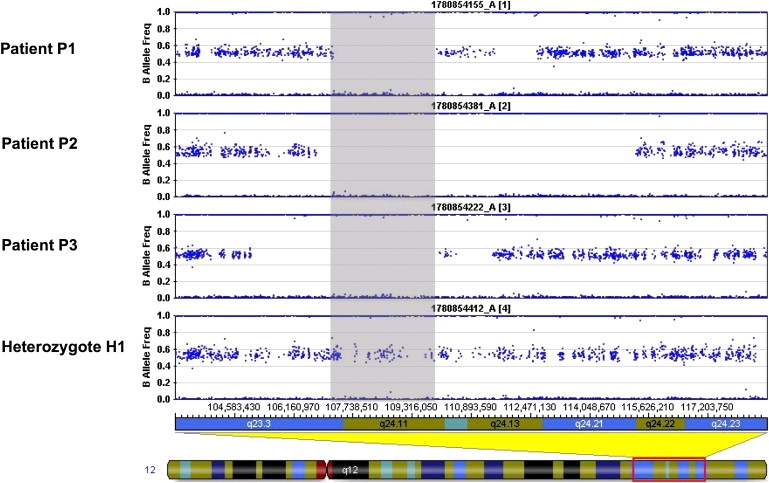
Figure 1.
Homozygosity Mapping by SNP Microarray in the Swedish Families
Homozygosity mapping by SNP array in the three northern Swedish families with myopathy and deficiency of succinate dehydrogenase and aconitase. Each panel shows results from the affected individuals (patients P1 to P3) and the unaffected family member (individual H1). The horizontal band in each panel represents heterozygous signal from two-allele SNP markers distributed along chromosome 12. The gray shaded box indicates a region of homozygosity (loss of heterozygous signal) at 12q shared by all three affected individuals and not the unaffected son H1 of affected individual P3.