
Figure 1.
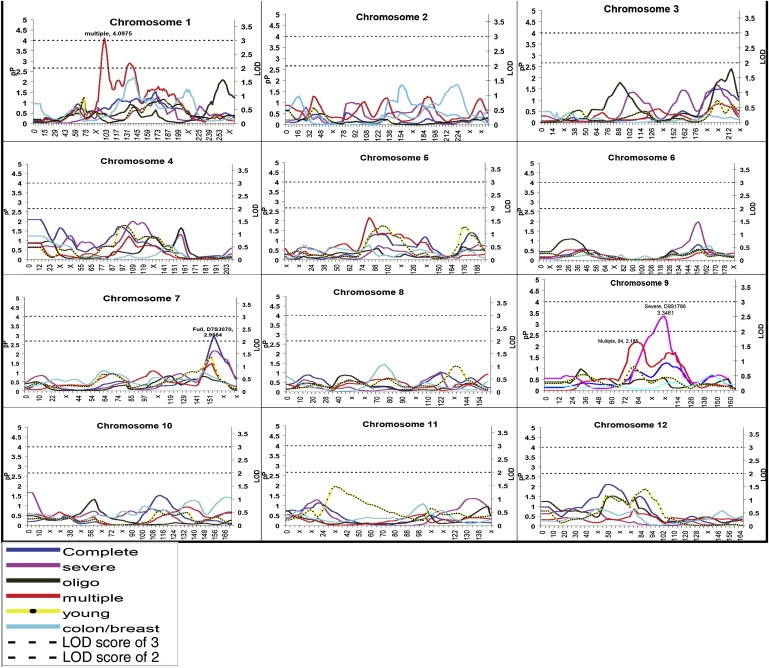
Plots for Chromosomes 1–12 for All Subgroups
Distance is plotted along the x axis and both −log10 (p value) denoted as pP and the LOD are plotted on the y axis for reference purposes. Reference lines at a LOD of 2 and 3 are provided, and significant data points are labeled with the phenotype location and pP value.