
Figure 4.
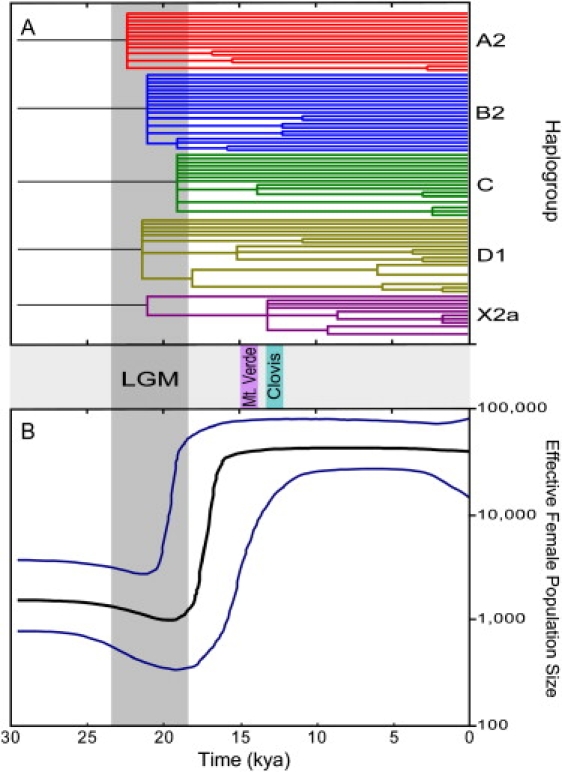
Phylogenetic Tree and Bayesian Skyline Plot for Native American mtDNAs
(A) Maximum-likelihood tree from 80 Native American mtDNA coding-region haplotypes. The time axis (in kya) was estimated with a parametric molecular-clock model calibrated with the assumption of human versus chimpanzee divergence at 6.5 million yr ago. Branches with bootstrap support < 0.5 were collapsed.
(B) mtDNA Bayesian skyline plot showing the Native American population size trend with a log-normal relaxed clock with the standard substitution rate of 1.26 × 10⁻⁸ sites/yr and a generation time of 25 yr. The y axis is the effective number of females. The thick solid line is the median estimate and the thin lines (blue) show the 95% highest posterior density limits estimated with 60 million chains. Approximate dates for the LGM, Monte Verde, and Clovis sites are shown in the middle panel. The time axis is limited to < 30 kya.