
Figure 1.
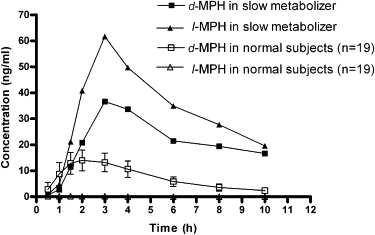
The Plasma Concentrations of d- and l-MPH in the Aberrant Metabolizer versus Study Peers
The plasma concentration versus time curve presenting individual isomer concentrations (d- versus l-MPH) in the aberrant metabolizer compared to the mean values of 19 study peers following a single 0.3 mg/kg dose of racemic MPH.