
Figure 6.
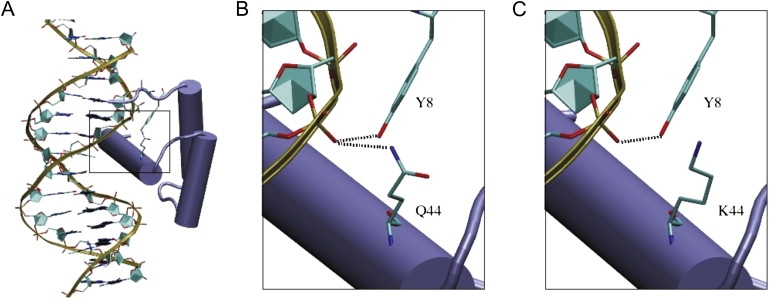
Representative Homology Models of the HOXA2 Homeodomain Bound to DNA
Overall schematic diagram of the protein-DNA complex (A) and close-up views of the wild-type (B) and Q44K (C) homeodomains. Hydrogen bonds are indicated by dashed lines.
Official websites use .gov
A
.gov website belongs to an official
government organization in the United States.
Secure .gov websites use HTTPS
A lock (
) or https:// means you've safely
connected to the .gov website. Share sensitive
information only on official, secure websites.
Representative Homology Models of the HOXA2 Homeodomain Bound to DNA
Overall schematic diagram of the protein-DNA complex (A) and close-up views of the wild-type (B) and Q44K (C) homeodomains. Hydrogen bonds are indicated by dashed lines.