
Figure 3.
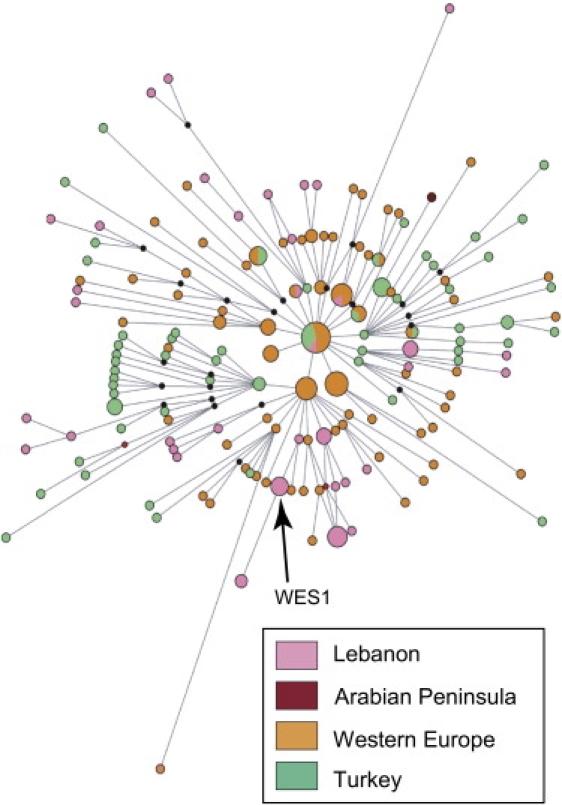
Network of STR Variation within Haplogroup R1b
Circles represent haplotypes defined by nine STRs; area is proportional to frequency, and color indicates the region of origin. Lines represent the mutational differences between haplotypes.
Official websites use .gov
A
.gov website belongs to an official
government organization in the United States.
Secure .gov websites use HTTPS
A lock (
) or https:// means you've safely
connected to the .gov website. Share sensitive
information only on official, secure websites.
Network of STR Variation within Haplogroup R1b
Circles represent haplotypes defined by nine STRs; area is proportional to frequency, and color indicates the region of origin. Lines represent the mutational differences between haplotypes.