
Figure 4.
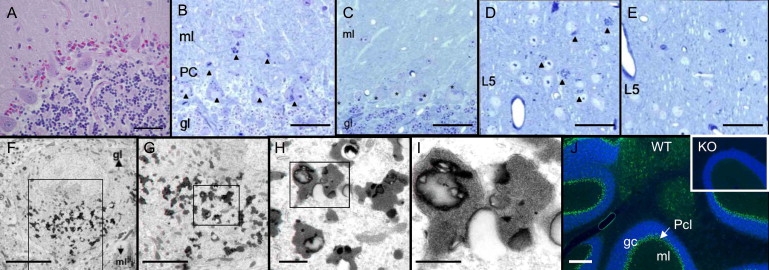
Neuropathology of AMRF and Limp2-Deficient Mice
(A) Human cerebellar vermis (autopsy sample; case C). Magenta-colored granules are seen between intact Purkinje cells (PAS stain; the scale bar represents 0.05 mm).
(B–E) Light microscopy of Limp2−/− brain in 16-month-old mice (semithin sections, toluidine blue). Cerebellar cortex of Limp2−/− mouse (B) shows all Purkinje cells (PC) as well as some neurons and glial cells in the molecular layer (ml) with numerous cytoplasmic inclusions (dense bodies) (arrowheads). In control wild-type mice (C), no inclusions are seen in the Purkinje cells (marked with asterisks), granular layer (gl), or ml. Sections of cerebral cortex from Limp2−/− show similar cytoplasmic inclusions that are in neuronal perikarya of laminae 2/3 and 5 (D) and that are absent in the cerebral cortex of wild-type mice (E). Layer 5 (L5) is shown. Scale bars represent 50 μm.
(F–I) Electron microscopy of Limp2−/− mouse brain. One Purkinje cell shown at increasing magnifications from left to right. The boxes indicate the region shown at higher magnification. The osmiophilic inclusions were most frequently observed within the perikarya and only very rarely within dendrites (not shown). The membrane-limited inclusions contain homogeneously granular material, some lipid droplets, and occasionally some lamellar structures. Scale bars represent 10 μm, 5 μm, 1 μm, and 0.5 μm, respectively.
(J) Immunohistological studies of mouse cerebellum. Wild-type cerebellar cortex (WT) is shown with nuclei stained with DAPI in blue. Limp2 is shown in green and is concentrated in the Purkinje cell layer (the scale bar represents 200 μm). The inset shows knockout (KO) with absence of Limp2 in the Purkinje cell layer.