
Figure 3.
Simulation Results for the Blood Stem Cell Model
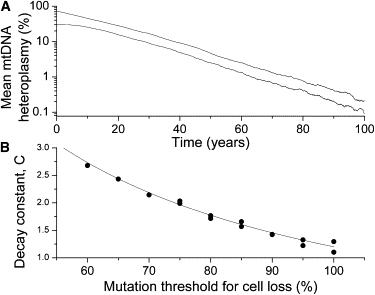
(A) An exponential decrease in mean mutation level in blood stem cell model. Results are shown for two simulations with different initial mutation levels, 70% and 30%. Other simulation parameters were Thalf = 10 days, N = 1000, and mthresh = 90%.
(B) Dependence of the decay constant C, defined in Equation 2, on the mutation threshold for loss of the stem cell, mthresh. The line is a fit to the data with Equation 3 (with R2 = 0.968 and p < 0.0001).