
Figure 2.
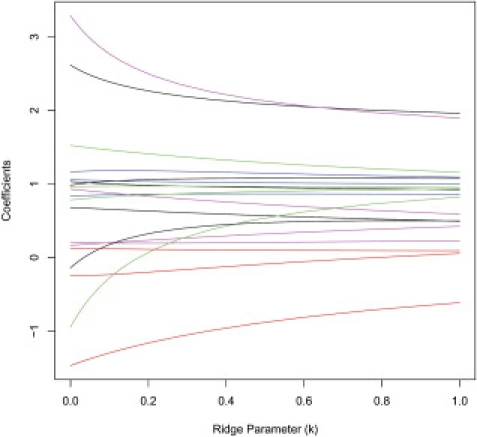
The Ridge Trace Associated with Analysis of the CHI3L2 SNPs
Each curve corresponds to the ridge regression coefficient estimate for one of the 26 loci of the CHI3L2 region for varying value of the ridge parameter k (x axis).
Official websites use .gov
A
.gov website belongs to an official
government organization in the United States.
Secure .gov websites use HTTPS
A lock (
) or https:// means you've safely
connected to the .gov website. Share sensitive
information only on official, secure websites.
The Ridge Trace Associated with Analysis of the CHI3L2 SNPs
Each curve corresponds to the ridge regression coefficient estimate for one of the 26 loci of the CHI3L2 region for varying value of the ridge parameter k (x axis).