
Figure 4.
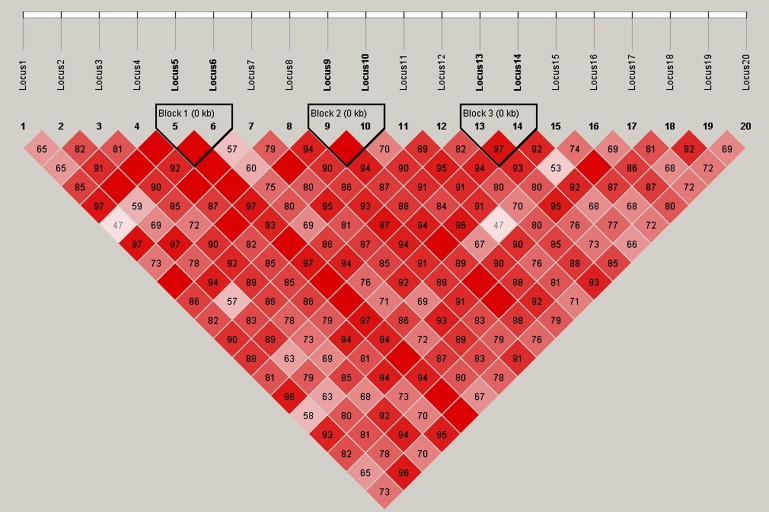
Haploview Plot of 20 SNPs Used in the Simulation Studies
Haploview (version 3.32) plot of the theoretical pairwise linkage disequilibrium among the 20 loci calculated from the respective frequencies of the 14 haplotypes used in simulating the genotype data for the first component of our simulation studies. Dashed line indicates ridge regression, dotted line indicates multiple linear regression, and solid line indicates single-locus analysis.