
Figure 3.
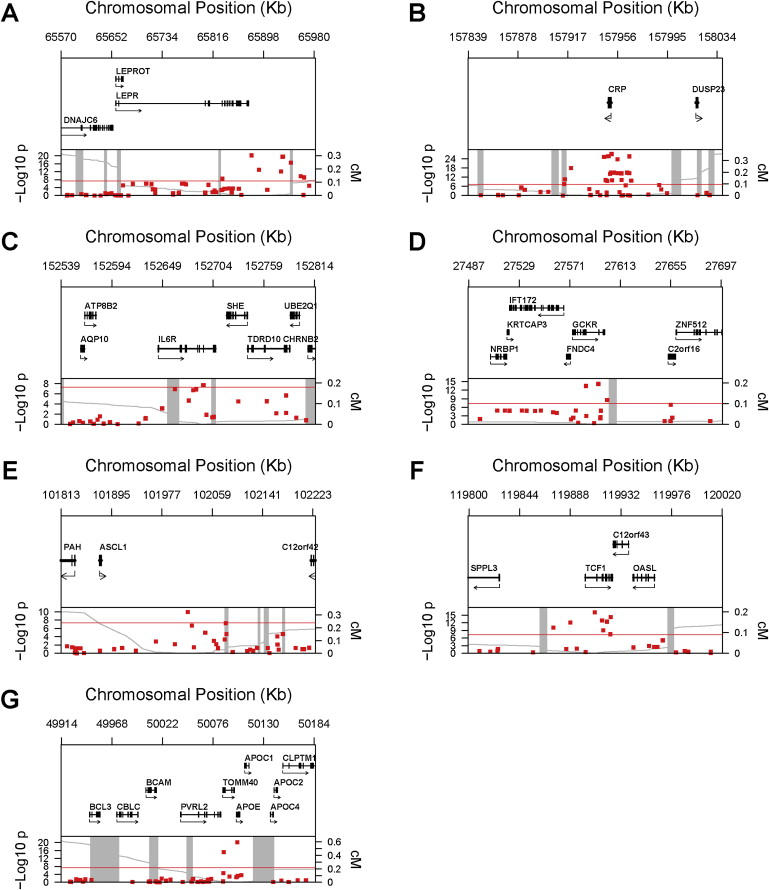
Genomic Context for Each of Seven Loci with Genome-wide Association with CRP Levels
(A) LEPR locus; (B) CRP locus; (C) IL6R locus; (D) GCKR locus; (E) gene-desert region on 12q23.2; (F) HNF1A locus; (G) APOE locus.
Upper panel: Genes from RefSeq release 25. Only one isoform is shown when multiple splicing variants are known.
Lower panel: SNPs are plotted according to their physical location with the y axis, indicating p values for association with CRP (red dots). Also shown is the genetic distance in cM from the lowest p value SNP for each locus (light-gray line), along with the position of recombination hotspots (light-gray vertical bars). Recombination rates and hotspots are based on HapMap data.32,33