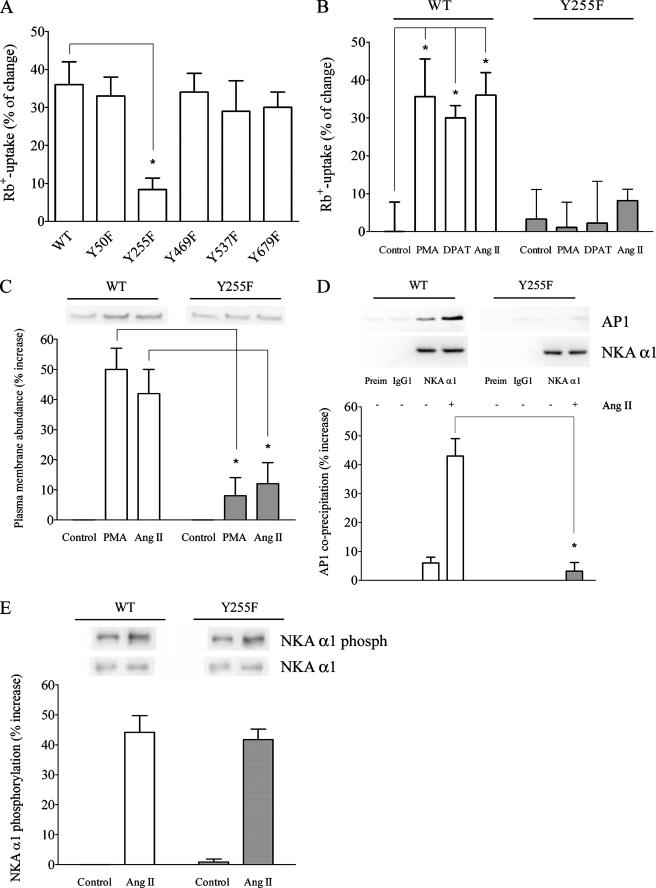
FIGURE 1.
Importance of Tyr-255 for the Ang II-dependent stimulation of NKA activity. A, the effect of Tyr-255 mutation on the Ang II stimulation of NKA-mediated Rb+ uptake. OK cells expressing WT or mutant forms of NKA α1 were treated with 1 pm Ang II for 10 min before the Rb+ uptake assay. The percentage of Rb+ uptake increase for each experimental condition was calculated with respect to a control that was not treated with Ang II. *, p < 0.05 with respect to OK WT α1 cells. B, the effect of the Y255F mutation on the stimulation of NKA-mediated Rb+ uptake by different activator/agonists. OK cells expressing the WT or Y255F mutant form of NKA α1 were treated for 10 min with 1 μm PMA, 3 μm 8-OH-DPAT, or 1 pm Ang II as described under “Experimental Procedures” before the Rb+ uptake assay. The percentage of increase for each experimental condition was calculated with respect to a non-treated control. *, p < 0.05 with respect to the control. C, the effect of the Y255F mutation on the Ang II-induced plasma membrane recruitment of NKA molecules. Cells were treated with either PMA or Ang II, and then the abundance of NKA molecules at the plasma membrane was determined by biotinylation as described under “Experimental Procedures.” Representative Western blots are shown in the upper panel. Quantitation of the Western blots is presented in the lower panel as the percentage of increase of NKA abundance at the plasma membrane. *, p < 0.05 with respect to the same treatment of OK cells expressing WT α1. D, the effect of the Y255F mutation on NKA-AP-1 coprecipitation. OK cells expressing either the WT or Y255F mutant form of NKA α1 were treated with 1 pm Ang II for 10 min and then dissolved with radioimmune precipitation assay buffer. Cell lysates were precleared with Preclearing Matrix E and incubated with ExactaCruz IP matrix conjugated to preimmune normal mouse serum (Preim), anti-actin C-2 (IgG1), and NKA α1 antibodies for 1 h. The matrix was separated by centrifugation and treated with Laemmli buffer. The precipitated proteins were separated by PAGE and transferred to polyvinylidene difluoride membrane, and Western blot analysis was performed with an anti-AP-1 antibody. Representative Western blots for AP-1 (AP1) and precipitated NKA α1 are shown in the upper panel. Quantitation data of precipitated AP-1 to NKA ratios are presented in the bar graph (lower panel) as a percentage of change of the Ang II-induced coprecipitation AP-1/NKA ratio with respect to a non-treated control. *, p < 0.05 with respect to the same treatment of OK cells expressing WT α1. E, Ang II-mediated phosphorylation of NKA α1. OK cells were treated with 1 pm Ang II for 10 min, NKA α1 was immunoprecipitated, and Western blot analysis was performed with an anti-phosphoserine antibody. Representative Western blots for NKA α1 phosphorylation (phosph) and precipitated NKA α1 are shown in the upper panel. Quantitation data of phosphorylated NKA α1 to precipitated NKA ratios are presented in the bar graph (lower panel) as a percentage of change of the Ang II-induced NKA α1 phosphorylation/NKA ratio with respect to a non-treated control.

