FIGURE 2.
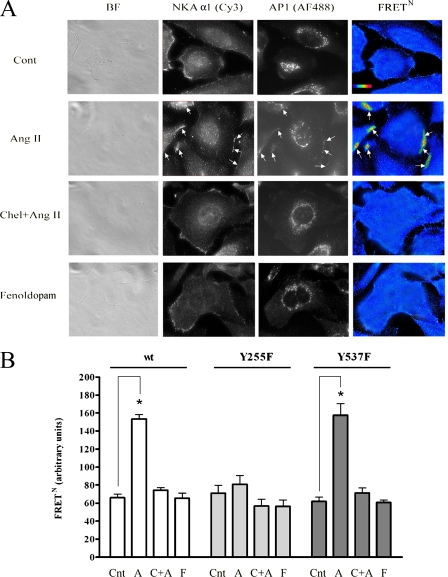
Interaction between NKA α1 and AP-1 determined by FRET. A, images of OK cells expressing NKA WT α 1 and treated with Ang II (1 pm, 10 min), the protein kinase C inhibitor chelerythrine chloride (2 μm, 30 min), or the D1R agonist fenoldopam (1 μm, 10 min). Left panels show bright-field images of representative cells for each treatment. Fluorescence images (right panels) were acquired through the Cy3 channel, the Alexa Fluor 488 channel, and the FRET channel. Cells were treated and images were acquired as described under “Experimental Procedures.” Cont, control; BF, brightfield. B, levels of normalized FRET. FRETN was calculated as described under “Experimental Procedures.” *, p < 0.05 with respect to non-treated cells. Cnt, control; A, angiotensin II; C+A, chelerythrine + angiotensin II; F, fenoldopam.

