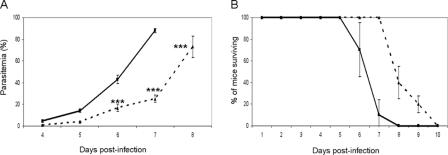
FIGURE 2.
A, parasitemia (percentage of infected erythrocytes ± S.D.) was monitored on Giemsa smears for the WT (solid line) and the Δpyhmgb2 (dashed line) parasite lines during days 4–8 of the infection. ***, statistically significant in a two-way analysis of variance test (p < 0.001). B, survival curves for mice infected by WT (straight line) and the Δpyhmgb2 (dashed line) parasite lines. The average of three independent experiments (five mice per group) with standard deviation is reported. Mice were monitored twice a day until all died. The difference between the survival curve is statistically significant as considered by the log-rank (Mantel-Cox) test (p value = 0.0023) or Gehan-Breslow-Wilcoxon test (p value = 0.0039).

