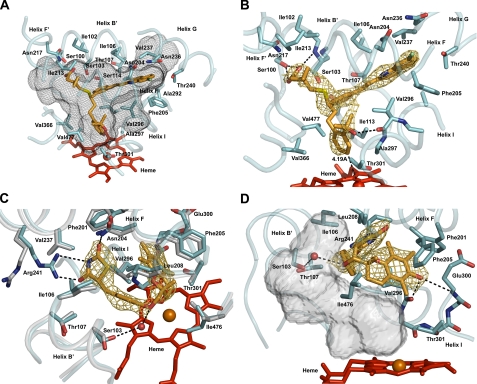
FIGURE 2.
Views of the ligand-binding site of P450 2C8 illustrating interactions of R-montelukast (A and B) or 2R,5R-troglitazone (C and D) with the protein. The heme prosthetic group is rendered as a red stick figure, with the central iron atom shown as a sphere. Portions of the secondary structure of the protein are rendered as a cyan ribbon, with side chains shown as stick figures with carbons colored cyan. In some cases, portions of the substrate-free structure (Protein Data Bank code 1pq2) are shown as a gray ribbon, with side chains shown as stick figures with carbons colored gray. The nitrogen, carbon, and oxygen atoms of the backbone are shown in some cases to illustrate hydrogen bonding interactions (black dashed lines). The distances between each ligand and the heme iron are indicated and identified by black dashed lines. Side chains making close contacts (<4 Å) are depicted and labeled if visible. The substrates are depicted as stick figures with carbon atoms colored orange. Other atoms are colored red for oxygen, blue for nitrogen, yellow for sulfur, and green for chlorine. The oxygen atoms of several water molecules that occupy the cavity are rendered as spheres.A gold mesh is used to render 2|Fo| - |Fc|σA-weighted ligand omit maps contoured at 1σ around the ligands. A black mesh is used to depict the solvent-accessible surface of the active-site cavity. The views differ between panels to clearly depict different features of the structures. The transparent solid surface in D illustrates the solvent-accessible surface of the volume that is left unoccupied upon troglitazone binding. The figures were rendered by ray tracing using PyMOL (DeLano Scientific, Palo Alto, CA).

