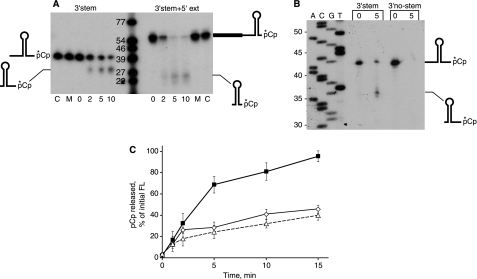
FIGURE 6.
A, degradation of 3′-end-labeled RNA oligonucleotides in the presence of RNase J1 for the indicated times (in min). Schematics of RNA substrates and products are on either side of the gel. Lanes C, RNA substrate incubated without RNase J1. Lanes M, RNA substrate incubated with mutant RNase J1. B, sizing of products on an 8% denaturing polyacrylamide gel. Schematics of RNA substrate and processed product are at the right of the gel. C, quantitation of pCp released from 3′-stem RNA (open diamonds), 3′-no-stem RNA (filled squares), and 3′-stem+5′-ext RNA (open triangles) after incubation with RNase J1 up to 15 min. Data are the average of three experiments ± S.D. FL, full length.

