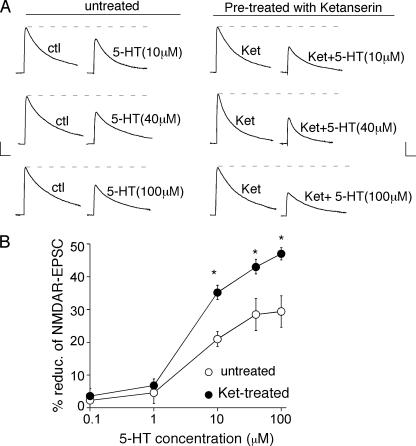
FIGURE 2.
Inhibition of 5-HT2A/C receptors unmasks the 5-HT1A -mediated reduction of NMDAR-EPSC in response to 5-HT. A, representative NMDAR-EPSC traces (average of three trials) showing the regulation of NMDAR-EPSC by 5-HT (10, 40, or 100 μm) in neurons treated with or without the 5-HT2A/C antagonist ketanserin (ket, 20 μm). Scale bars: 100 pA, 100 ms. B, dose-response curves summarizing the percentage reduction of NMDAR-EPSC by different concentrations of 5-HT in neurons treated with or without ketanserin. *, p < 0.001, ANOVA.

