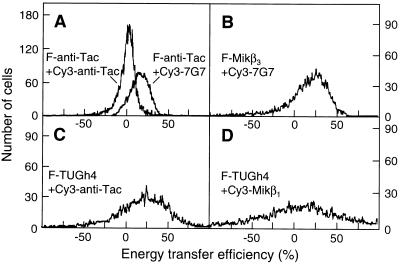
Figure 1.
Representative flow cytometric histograms of energy transfer efficiencies measured between FITC (F)- and Cy3-conjugated mAbs bound to IL-2R α, β, and γ subunits on Kit 225 K6 T cells. Averages and error estimates (E ± ΔE) of mean values of flow cytometric energy transfer histograms for the indicated donor–acceptor pairs were calculated from data of three to five independent measurements: (A) 1.5 ± 0.1% for F-anti-Tac + Cy3-anti-Tac, 18.2 ± 3.5% for F-anti-Tac + Cy3–7G7; (B) 25.4 ± 5.9% for F-Mikβ3 + Cy3–7G7; (C) 20.6 ± 5.1% for F-TUGh4 + Cy3-anti-Tac; and (D) 12.4 ± 5.0% for F-TUGh4 + Cy3-Mikβ1. Displacement from a mean value of 0 indicates energy transfer and nonrandom proximity of the epitopes.

