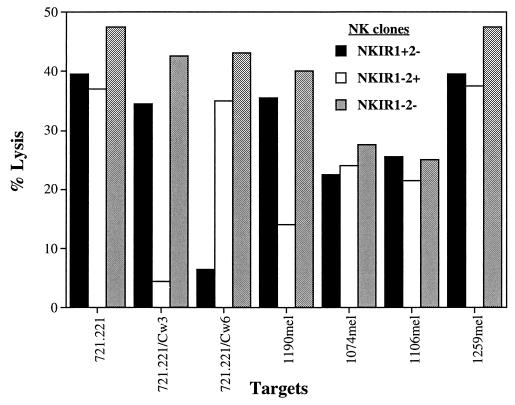
Figure 2.
Cytotoxicity of different NK clones against melanoma lines. NK clones were generated as described. NK clones are classified based on their NKIR1 and NKIR2 expression as determined by flow cytometry using the mAb EB6 (NKIR1) and GL183 (NKIR2) (22). Different NK clones with the same classification manifested similar lysis patterns, and each lysis point is the average lysis of two NK clones from the same group. Clones were reacted with the indicated [35S]methionine-labeled target cells for 5 h. Data obtained at an E/T of 1/1 are shown. The range was under 5% of the mean of triplicates in this and all following experiments (see Figs. 3, 4B, 5, and 6).

