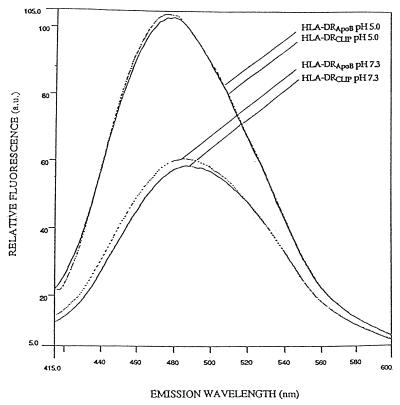
Figure 2.
Binding of ANS to HLA-DR complexed to CLIP or ApoB(2877–2894) shows similar conformational changes of the complexes upon pH variation. Solid lines show binding of ANS to 40 nM DR3/CLIP complexes at pH 7.3 and 5.0 and dashed lines represent binding of ANS to 40 nM DR3/ApoB(2877–2894) complexes at the same pH values. The fluorescence emission spectra (415–600 nm) after excitation at 350 nm were recorded 2 min after addition of the class II molecules or after adjustment of the pH values.

