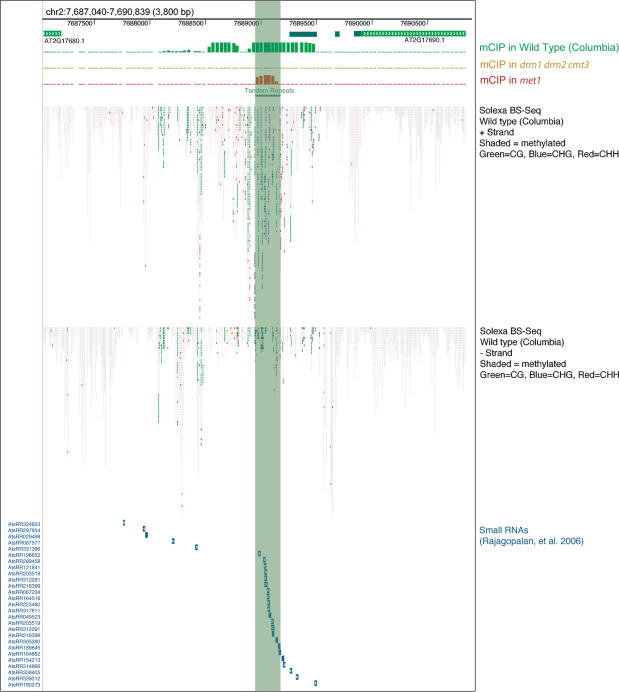
Figure 1.
Epigenomic profile of SDC. Graphical representation of DNA methylation and siRNAs detected in the region of SDC (At2g17690). The SDC ORF is indicated as a light-green bar marked with chevrons. The SDC 5′-UTR mapped by RACE is highlighted by dark green bars. The promoter tandem repeats are marked by the light green block running down the figure. DNA methylation detected by methyl-cytosine immunoprecipitation (mCIP) and hybridization to genomic tiling arrays is highlighted beneath as colored bars in wild type (green), drm1 drm2 cmt3 (orange), and met1 (red) (Zhang et al. 2006). Methylation state of individual cytosines as measured by Solexa sequencing of bisulfite treated DNA is represented as small rectangles. Methylation is shown by shading (dark is methylated) and color-coded according to sequence context (CG, green; CHG, blue; CHH, red) (Cokus et al. 2008). Small RNAs detected by sequencing are represented by blue bars with white chevrons indicating their strandedness (Rajagopalan et al. 2006).

