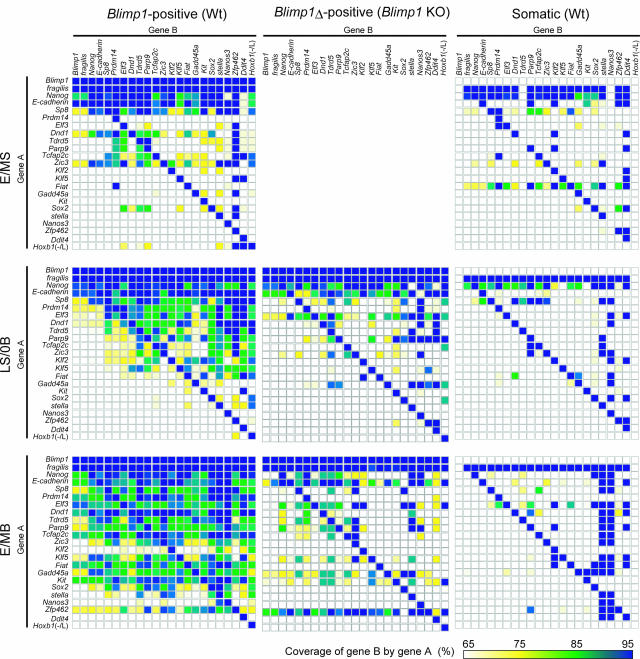
Figure 6.
Expression coverage analysis of the selected genes. The expression coverages of genes shown as Gene B by genes shown as Gene A in the wild-type Blimp1-positive cells (left), Blimp1 KO cells (middle), and Blimp1-negative somatic cells (right) at the E/MS (top), LS/0B (middle), and E/MB (bottom) stages are shown according to the color code at the bottom.

