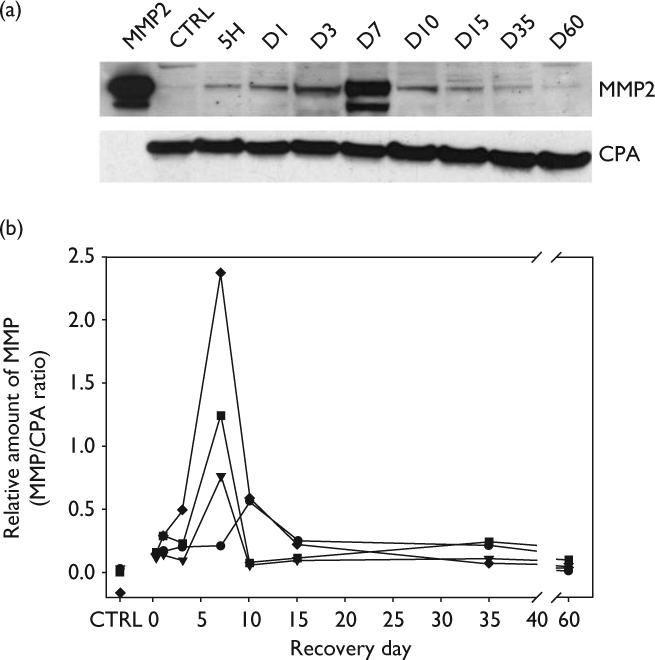
Fig. 1.

Analysis of MMP-2 expression in the olfactory bulb following olfactory nerve transection injury in P2 mice. (a) Representative Western blot illustrating changes in MMP-2 expression at different time points following injury. Lane 1 shows pro (upper band) and active forms (lower band) of purified murine MMP-2 standard. Lane 2 shows that MMP-2 is barely detectable in control mice (CTRL). Cyclophilin A (CPA) expression at each time point was used to adjust for differences in protein loading. (b) Plot of the relative amounts of MMP-2 (pro and active forms included in the quantification) from four separate experiments expressed as percentages of CPA. Each experiment represents data from nine separate mice. MMP-2 levels initially increased slowly, rose rapidly after day 3 to a maximum at day 7. MMP-2 levels declined rapidly between day 7 and day 10. CPA, Cyclophilin A; MMP, matrix metalloproteinases.
