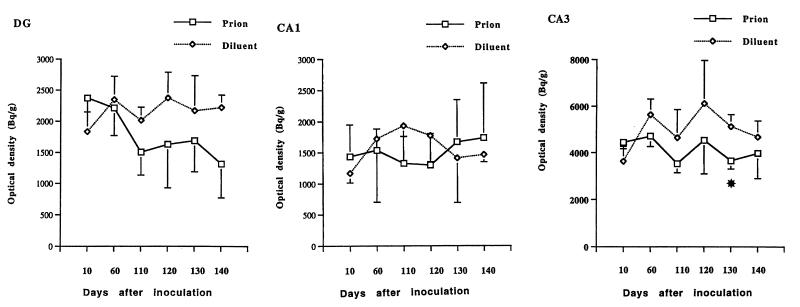
Figure 5.
Graphs showing quantitative evaluation of Y2-R mRNA levels in the dentate gyrus (DG) and in the CA1 and CA3 regions of the hippocampal formation after varying time intervals of prion inoculation or diluent injection. No significant differences can be observed except for a statistically significant decrease in the CA3 pyramidal cells layer 130 days after inoculation (P < 0.01). The data were analyzed with two-tailed unpaired t tests.

