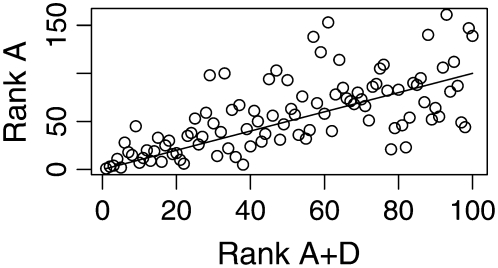
Figure 1.—
Rank of the additive genetic effects for the additive (A) and additive plus dominance (A + D) models of Scots pine diameter. The y-axis plots the position in the A model of the 100 highest ranked individuals in the A + D model. The straight line indicates no discrepancy in rank between the two models.

