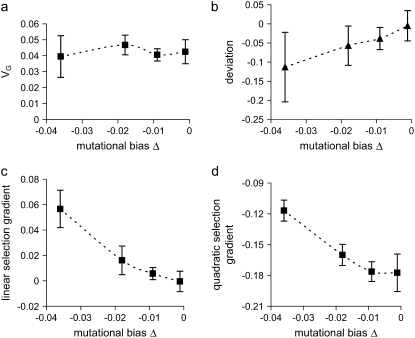
Figure 3.—
Influence of mutational bias on (a) genetic variance, (b) the mean–optimum deviation, (c) the linear selection gradient, and (d) the quadratic selection gradient. Increasing and decreasing mutational effects on the trait have a gamma distribution with τa = 0.1 and a higher probability, P =  (1 − Δαa/τa), of having negative values, and pleiotropic effects on fitness are exponentially distributed with mean E(s) = 0.05. The population size is N = 600.

