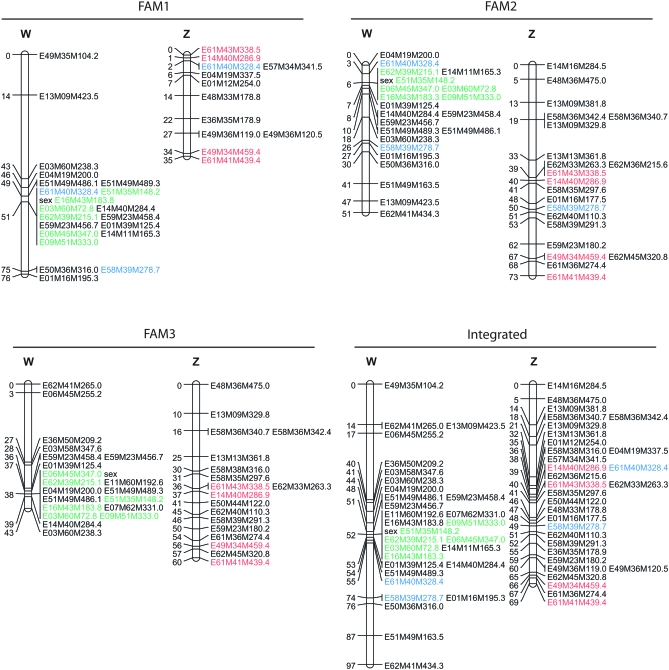
Figure 1.—
Separate and integrated linkage maps of the sex chromosomes from FAM1, FAM2, and FAM3. Distances are given in Kosambi centimorgans. Markers in blue were used for the identification of the Z-linkage group, markers in red on the Z chromosome segregate in each family, and markers in green are completely linked to the sex locus in each family. The integrated linkage groups, constructed with linkage data from FAM1, FAM2, and FAM3, are slightly different in marker order and intermarker distance from the linkage groups IC67_1 and AL91_1 that were constructed with linkage data from FAM2 and FAM3 and FAM1 and FAM2, respectively.

