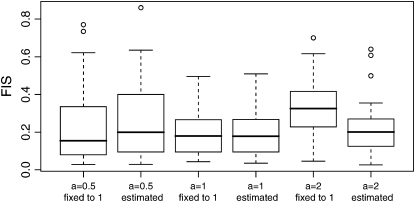
Figure 3.—
Box plot of the estimates of FIS based on 50 replicates of three different data sets, depending on the value of the hyperprior parameter a using the full model presented in Figure 2 (a estimated) and the original model presented in Holsinger et al. (2002) with a flat hyperprior on ancestral allele frequencies (a fixed to 1). Data sets are based on five populations and 100 loci, FST = 0.1, and 50 individuals in each population; FIS is fixed to 0.2. Boxes are constructed using the lower quartile and the upper quartile so that 50% of the values are in the boxes. The horizontal solid line in the box gives the median. The vertical dashed lines are called the “whiskers” and indicate the minimum and maximum values but only if they lie within 1.5 times the box height (the interquartile range). Points (solid circles) outside the whiskers are outlier values and are plotted.

