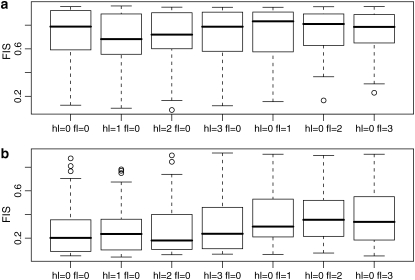
Figure 8.—
Comparison of the estimates of FIS based on the same simulated data sets presented in Figure 6. There are 50 replicates of different data sets with the ascertainment bias hl and fl varying independently from 0 to 3. Estimates are made taking into account the ascertainment bias in the ABC algorithm presented in the text. (a) FIS is fixed to 0.8; (b) FIS is fixed to 0.2. Data sets are based on five populations and 100 loci, FST = 0.25, and 30 individuals per population.

