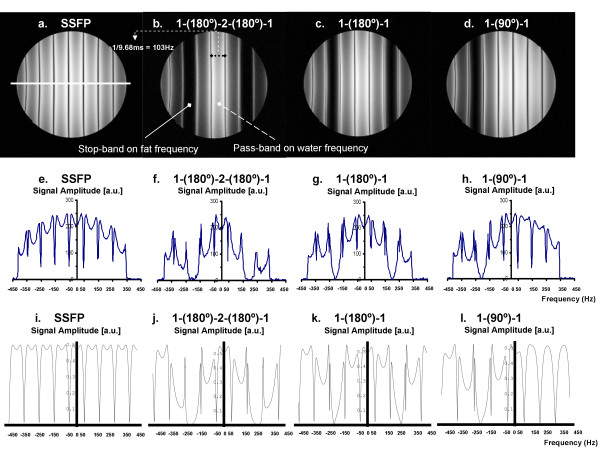
Figure 2.
A comparison of measured and simulated frequency response patterns for SSFP and WE-SSFP. Top two rows demonstrate measured frequency response functions in a uniform water phantom for (a) conventional slice-selective RF pulse, (b) 1-(180°)-2-(180°)-1, (c) 1-(180°)-1, and (d) 1-(90°)-1. All four sequences were run with TR = 9.68 ms and constant gradient offset of 0.0723 mT/m left-to-right to illustrate the signal over a range of offset frequencies. Middle row (e-h) shows the signal profile across the phantom for each of the corresponding images. The white line across (a) indicates the location of the signal profile measurement for each image. Bottom row (i – l) shows simulated frequency response functions for the same four sequences used to generate the phantom images (a-d) and signal profiles (e-h). Reasonable agreement is observed between phantom measurements and simulation results.

