Figure 5.
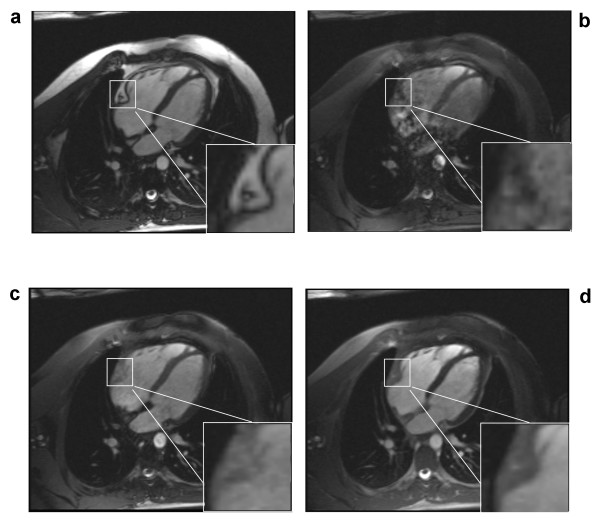
Cardiac images acquired in a normal human subject in four-chamber view using (a) conventional slice-selective RF pulse with TR = 3.1 ms, (b) 1-(180°)-2-(180°)-1 with TR = 8.9 ms, (c) 1-(180°)-1 with TR = 6.5 ms, and (d) 1-(90°)-1 WE-SSFP sequences with TR = 4.0 ms. Flip Angle/Slice Thickness/Matrix = 70°/5 mm/256 × 192 for all images. A magnified region is shown in the lower right corner of each image to illustrate the signal in epicardial fat surrounding the right coronary artery in the atrioventricular groove. Significant fat signal attenuation is demonstrated by all binomial WE pulses, and no perceptible artifacts are observed in the 1-(90°)-1 WE-SSFP images. All figures are displayed with the same window and level settings.

