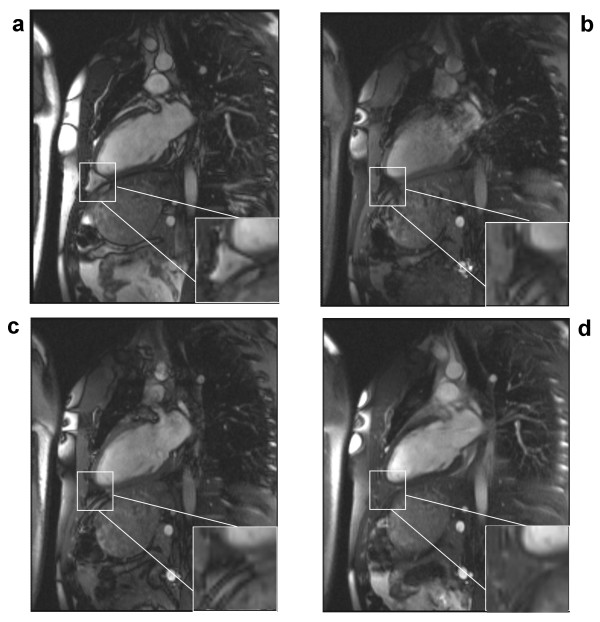
Figure 6.
Cardiac images acquired in a normal human subject in vertical long-axis view using (a) conventional slice-selective RF pulse with TR = 3.1 ms, (b) 1-(180°)-2-(180°)-1 with TR = 8.9 ms, (c) 1-(180°)-1 with TR = 6.5 ms, and (d) 1-(90°)-1 WE-SSFP sequences with TR = 4.0 ms. A magnified region is shown in the lower right corner of each image to illustrate the signal in epicardial fat surrounding the apex of the left ventricle. The phase-modulated 1-(90°)-1 WE-SSFP sequence decreases the fat to myocardium signal ratio and provides a valuable method of differentiating fluid from adipose tissue. All figures are displayed with the same window and level settings.

