
Figure 2.
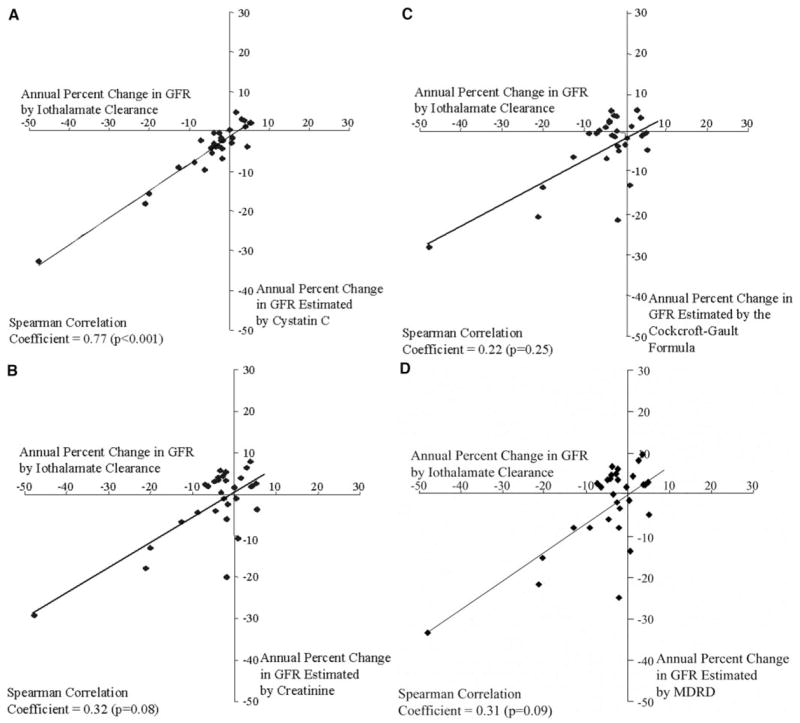
Correlation between estimates of the annual percentage change in renal function as determined from serial measurements of standardized iothalamate clearance and four indirect measures in 30 Pima Indian participants. Points in the lower right quadrant of a plot represent false-positive results for declining renal function (defined by an annual percentage change in iothalamate clearance <0 ml/min per 1.73 m2). Points in the upper left quadrant of a plot represent false-negative results for declining renal function (defined by an annual percentage change in iothalamate clearance ≥0 ml/min per 1.73 m2). Operating characteristics for trends in renal function estimated by cystatin C (A) are described in the text. The operating characteristics (sensitivity and specificity) of trends estimated by 100/creatinine (B), Cockcroft-Gault formula (C), and MDRD equation (D) were 50% and 70%, 60% and 60%, and 50% and 70%, respectively.