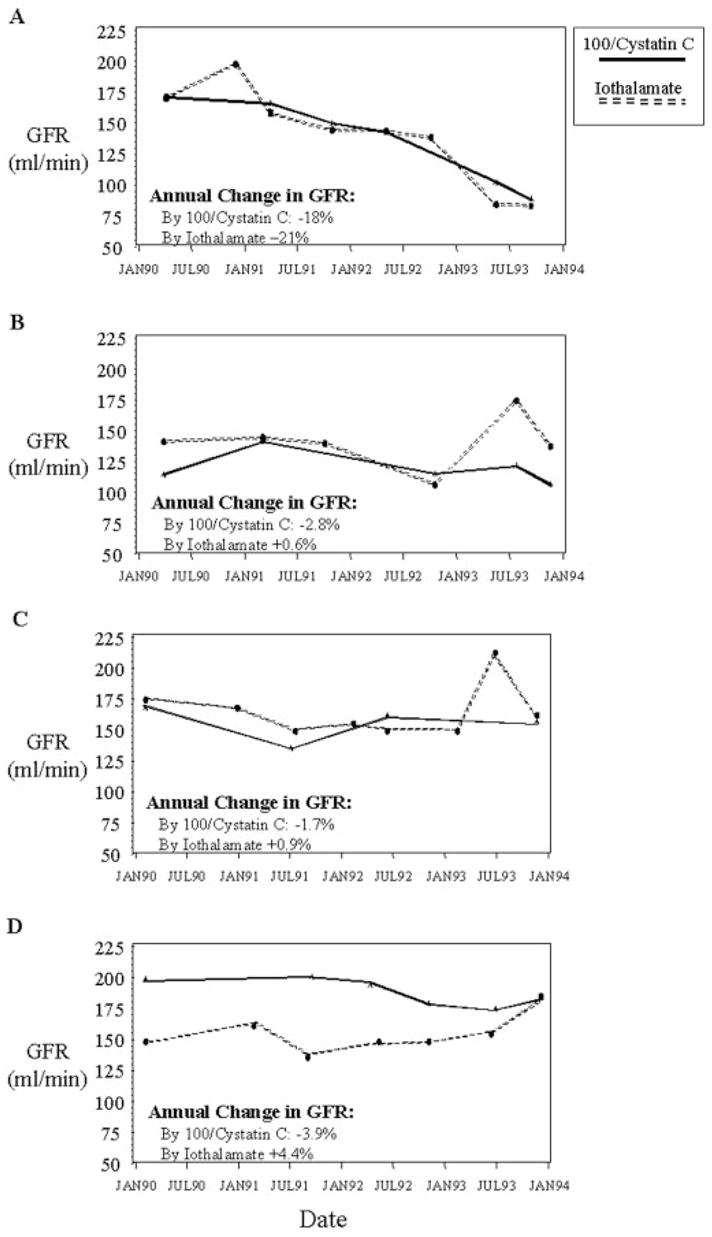
Figure 3.

Serial determinations of renal function by standardized iothalamate clearance and by 100/cystatin C. The rate of change in renal function for each individual was estimated by linear regression of the determinations (transformed to the logarithmic scale) over time and expressed as the annual percentage change. (A) A participant with rapidly declining GFR. (B through D) Three individuals with disagreement between the trends in iothalamate clearance and 100/cystatin C for determining declining renal function. All examples illustrate the greater variability of standardized iothalamate clearance than 100/cystatin C. Within-individual SD for standardized iothalamate clearance was 14, 16, 16, and 9% for examples 1 through 4, respectively. For 100/cystatin C, it was 10, 11, 15, and 5%, respectively.
