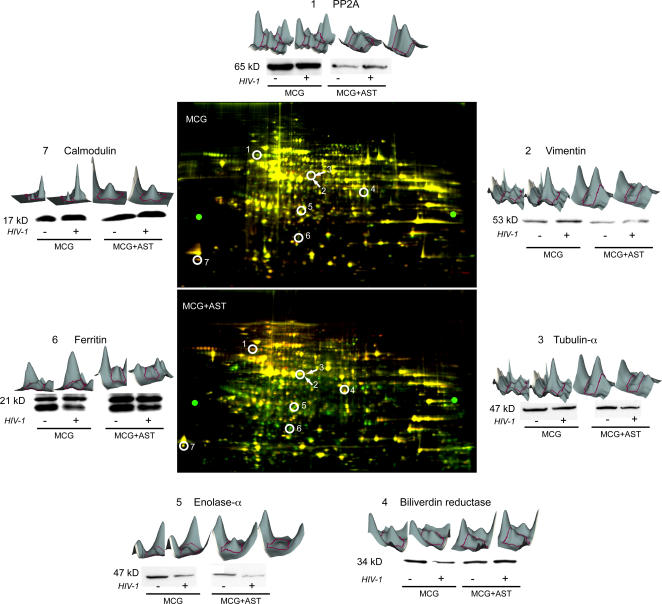
Figure 2. Proteome of HIV-1/VSV infected microglia (MCG) and MCG co-cultured with astrocytes (AST).
DiGE analyses of lysates of uninfected and HIV-1/VSV infected microglia cultured alone (MCG, upper gel) or in the presence of astrocytes (MCG+AST, lower gel) Proteins from uninfected microglia lysates are labeled with Cy3 (green), whereas those from HIV-1/VSV infected microglia are labeled with Cy5 (red). After merging, proteins exhibiting no changes appear yellow in the DiGE image, down-regulated proteins in green, and up-regulated proteins in red. Three-dimensional DeCyder interpretation for seven representative proteins identified by mass spectrometry and corresponding Western blot analysis are shown around the DiGE images. Each pair of protein spots (Cy3-and Cy5-labeled) are 3D views of their relative peak volumes. The peak area comprising the entire volume represents the distribution of the protein spot in the gel, whereas the volume correlates to the protein concentration. The consecutive numbers of spots located in the respective DiGE images correspond to the protein volumes shown.

