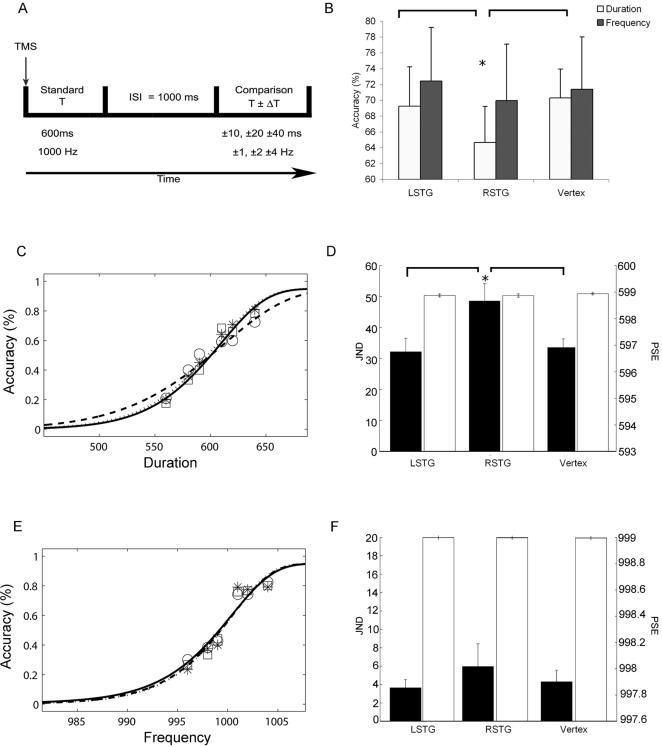
Figure 2. Results.
A) Timeline of the experimental paradigm; B) Percentage of accurate responses and standard errors across the three TMS sites for the duration (white bars) and the frequency (black bars) discrimination tasks. Asterisk indicates significant differences in Tukey’s tests (* p<0.02). In order to check that the two tasks were well matched in terms of difficulty we also compared the two tasks after vertex stimulation (vertex Duration versus vertex Frequency: T7 = −0.21 P = 0.8). C–E) Group accuracy data (number of hits/total number of targets) across different comparison durations, for rTMS of the vertex (□), right (○) and left (*) STG. The line fitting the symbols are averaged fitted functions (obtained fitting the group averaged data). Solid lines represent rTMS of the vertex, dashed lines rTMS of right STG and dotted lines rTMS of the left STG. C) is the duration discrimination task E) is the frequency discrimination task. D–F) JND (black bars) and PSE (white bars) group data for temporal (D) and frequency (F) discrimination tasks as a function of TMS conditions. Asterisk indicates significant differences in Tukey’s t-tests (* p = 0.04).

