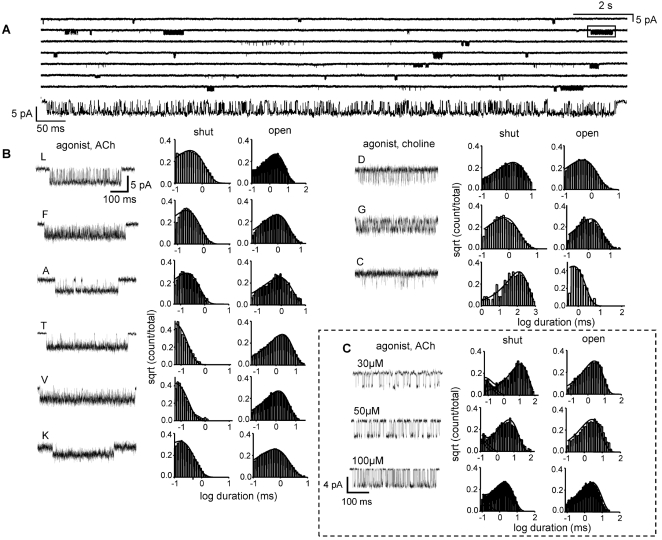
Figure 2. An example single-channel kinetic analyses (residue αE262; 20′).
(A) Low time-resolution view of a continuous current trace for the mutant αE262L activated by 500 µM ACh (opening is down). Expanded view of boxed cluster shown, below. The long shut periods between clusters of openings represent desensitized AChRs. (B) Example clusters and interval duration histograms of 9 different αE262 mutations. Loss-of-function mutants (L, F, A, T, V and K) were activated by 500 µM ACh and gain-of-function mutants (D, G and C) were activated by 20 mM choline. Note the small single-channel current amplitude for the αE262K construct. (C) Estimation of ACh binding and gating rate constants in αE262L. Example clusters and shut/open interval duration histograms from AChRs activated by ACh. The solid lines are calculated from the rate constants obtained from the globally-optimized rate constants for all three patches (number of intervals: 30 µM, 2,336; 50 µM, 2,978; 100 µM, 8,631). There is no significant effect of this mutation on ACh binding to closed AChRs.

