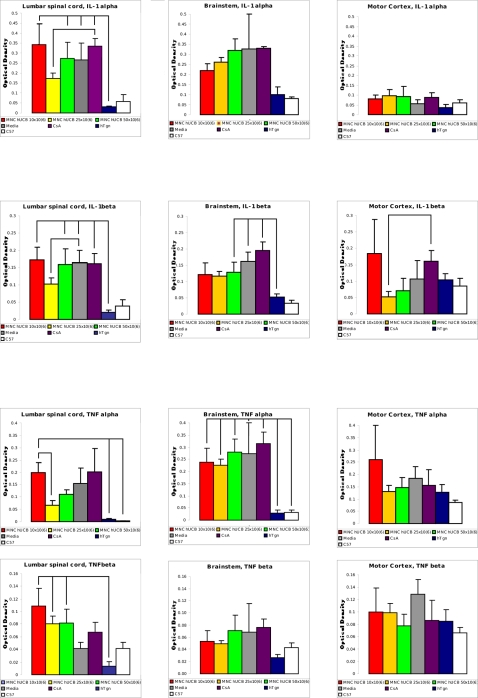
Figure 3. Cytokine profile in the lumbar spinal cord, brainstem, and motor cortex of G93A mice administered with different MNC hUCB cell doses.
The RNase protection assay was used to determine the mRNA expression of proinflammatory cytokines IL-1 α, IL-1 β, TNF α, and TNF β in the lumbar spinal cord (left column), brainstem (center column), and motor cortex (right column) of G93A mice administered with different MNC hUCB cell doses. Control groups were Media, CsA, hTgn, and C57BL/6 mice. The mRNA expression presented as the optical density (OD) values obtained from each band normalizing against the OD obtained from the L32, a house-keeping gene, band. Lines indicated significant differences (p<0.001, p<0.01, and p<0.05) between mouse groups (see Results).

