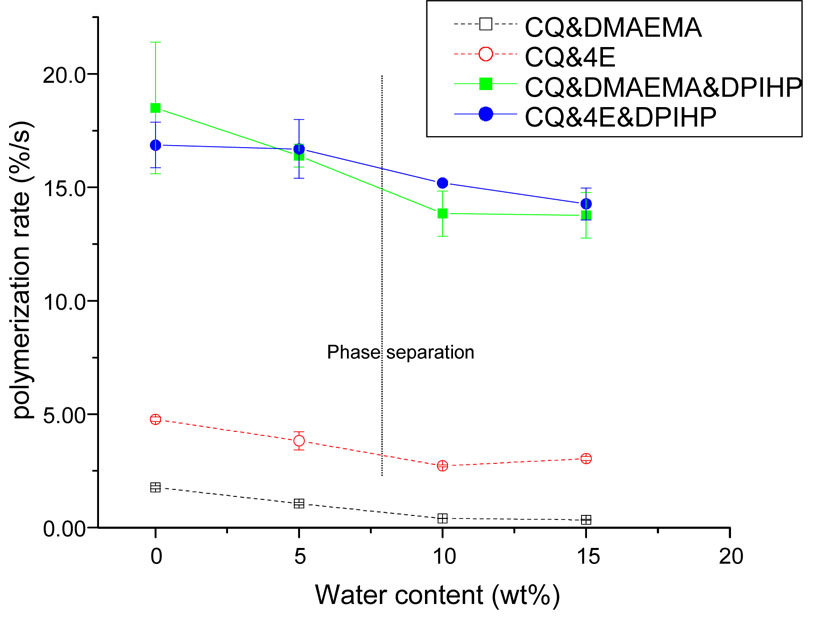
Fig. 6.
Polymerization rates of the model adhesives containing different initiator systems and different water content. The black vertical line indicates that the monomers/water phase separation occurs, which is at the presence of ~8 wt% water content. The small vertical bars signify standard deviations (n=3). In mixtures containing only the two-component systems, polymerization rates showed significant difference between CQ/DMAEMA and CQ/4E (p < 0.02) in the presence of different water contents (0 to 15 wt%). For the three-component systems, polymerization rates were not significantly affected by water content (p > 0.1).

