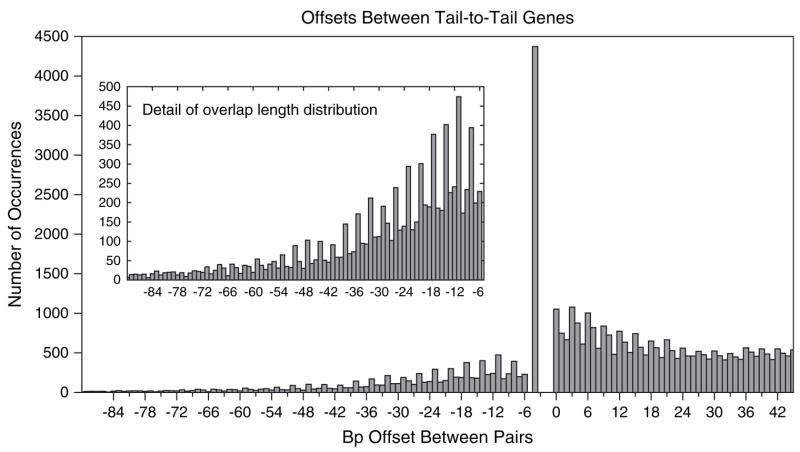
Fig. 1.
Histogram of overlap lengths and separation distances between adjacent pairs of tail-to-tail (convergently transcribed) genes, computed from a nonredundant set of bacterial and archaeal genomes. Only molecules with at least 250 annotated genes were considered. Negative values indicate overlap lengths, whereas positive values indicate bases of separation. Inset shows the detail in the range −90, …, −6.

