Figure 1.

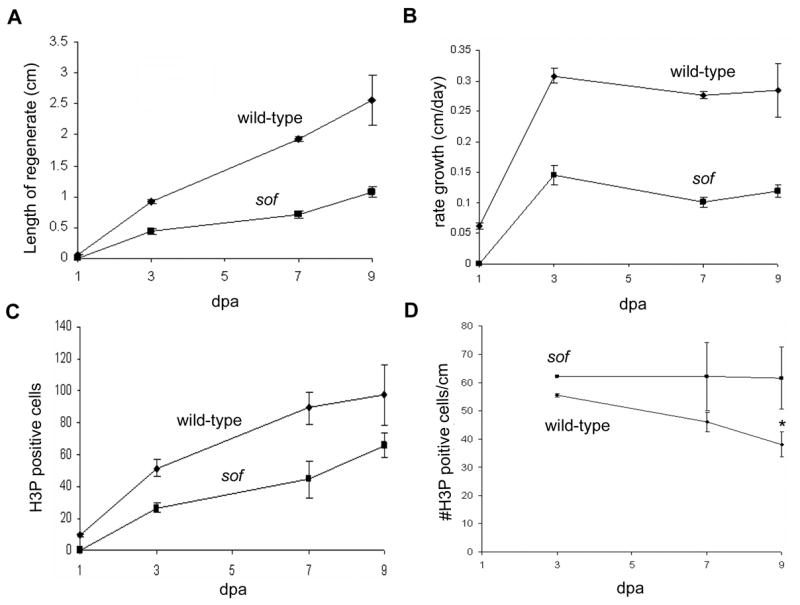
Growth rate and the number of mitotic cells are reduced in sofb123 mutants during regeneration. Measurements of regenerates in wild-type and sofb123 fins were conducted over a period of nine days. (A) The length of the sofb123 regenerate is half as long as the wild-type regenerate. Standard deviation is shown. (B) The rate of regeneration is slower in sofb123 mutants. Standard deviation is shown. (C) The number of mitotic (H3P positive) cells is reduced in sofb123 mutants compared to wild-type. Standard deviation was calculated and the student’s t-test reveals all data points between wild-type and sofb123 are statistically different (p = 0.0001; 0.0008; 0.0042; 0.0454 for 1,3,7,9 dpa). (D) The number of mitotic cells per cm is the same between wild-type and sofb123 fins. Standard deviation was calculated and the student’s t-test reveals data points through 7 dpa are not statistically different (p > 0.06). The data points at 9 dpa are statistically different, p = 0.0001 (*).
