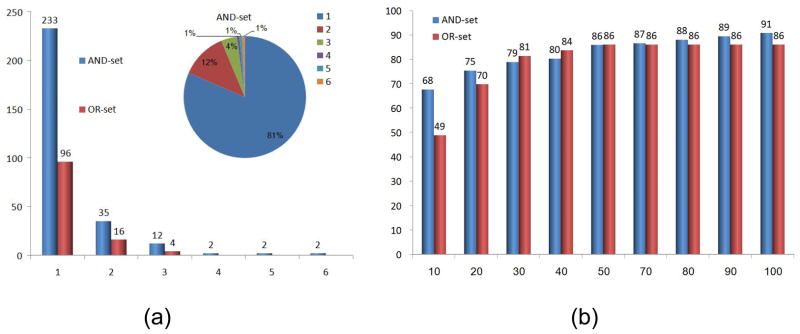
Figure 3.
(a) Clusters of dinucleotide binding sites. A histogram of the cluster sizes of the AND-set and OR-set classifications. The X-axis denotes the number of cluster members and the Y-axis is the number of clusters of this size. The top right pie chart shows the distribution of the cluster sizes of the AND-set. The distribution of clusters in the OR-set was very similar. (b) Success rates of the predictions of dinucleotide binding sites, measured by the leave-one-out tests. The X-axis denotes the number of the top ranking solutions considered in each prediction. The Y-axis is the overall success rate measured by the percentage of binding sites correctly predicted in all the leave-one-out tests performed with the AND-set and OR-set classifications.

