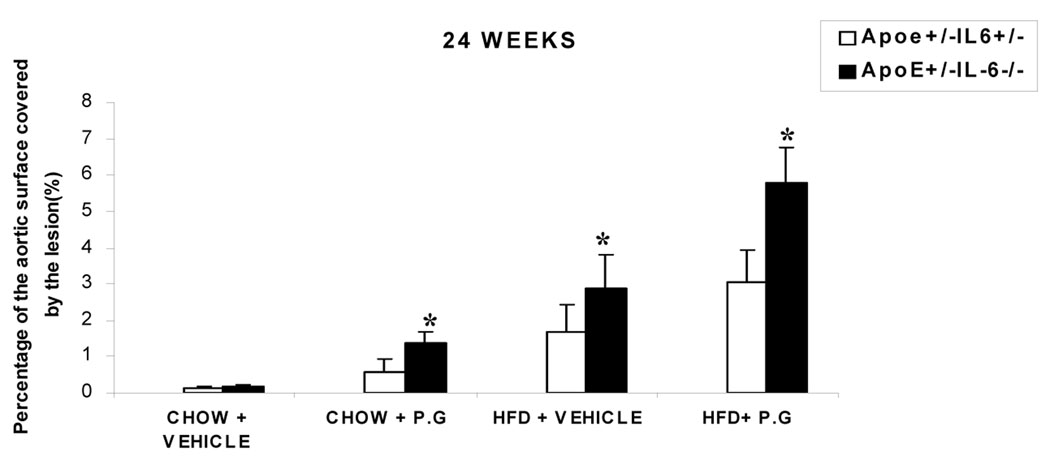
Figure 2.
En face analysis: percentage of aortic surface area covered by lesions in chow-fed or HFD groups for 2 genetic background mouse groups (ApoE+/−-IL-6−/− and ApoE+/−-IL-6+/−) inoculated with P gingivalis or vehicle for 24 weeks. Values represent mean±SD, *p <0.05 for ApoE+/−-IL-6−/−mice as compared to ApoE+/−-IL-6+/− mice in same condition on same diet. Abbreviations are as defined in text.

