Figure 3.
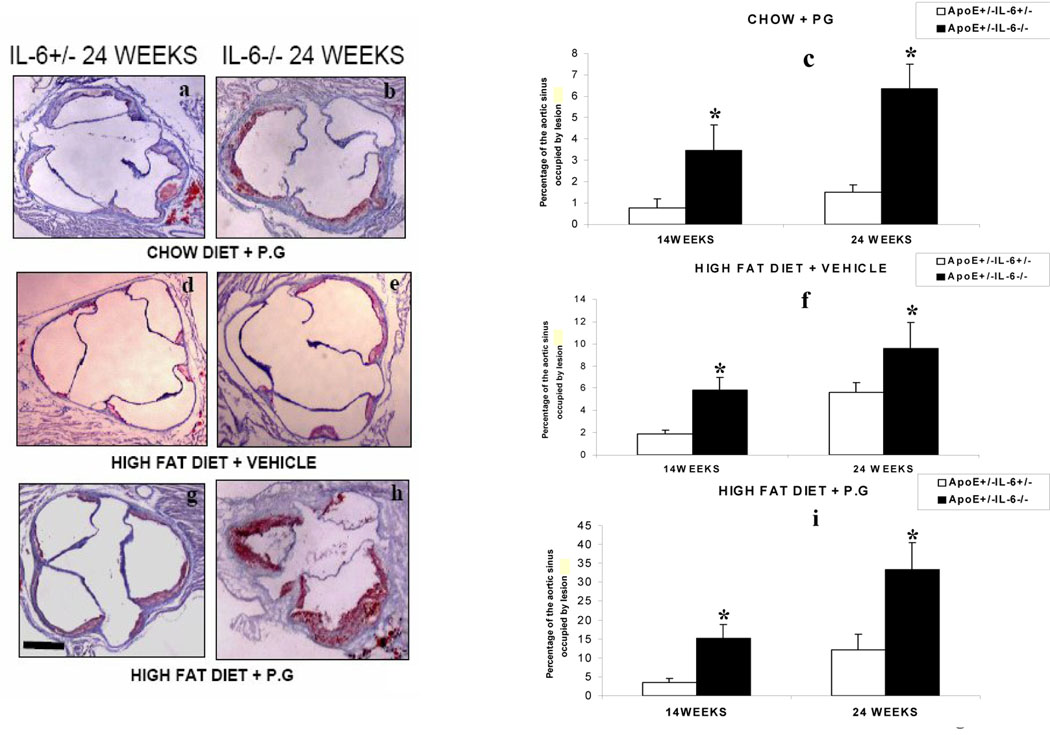
Microscopic cross sections (10 µm) of the proximal aortic root were stained with sudan and counterstained with hematoxylin to reveal lipid deposition and quantified by digital morphometry for both ApoE+/−- IL-6−/− mice and ApoE+/−-IL-6+/− mice maintained on standard chow diet and inoculated weekly with Pg (CP)(fig-3c), on high fat diet and inoculated weekly with vehicle (HS)( (normal saline) fig-3f) and on high fat diet and inoculated weekly with P.g.(HP)( fig-3i) .The data is presented as percentage of total lumen of the proximal aorta occupied by lesions at 14 weeks and 24 weeks. Values represent mean±SD, *p <0.05 for ApoE+/−-IL-6−/−mice as compared to ApoE+/−-IL-6+/− mice in same condition on same diet. Abbreviations are as defined in text. Photomicrographs shown are representative images used to obtain the data presented in (Fig-3c, 3f & 3i), of proximal aortic lesions in ApoE+/−-IL6+/− and ApoE+/−-IL-6−/− mice maintained on standard chow diet and inoculated weekly Pg (CP)(fig-3a & 3b), on high fat diet and inoculated weekly with vehicle(normal saline) (HS)(fig-3d & 3e) and on high fat diet and inoculated weekly with P.g.(HP) ( fig-3g & 3h) for 24 weeks. Original magnifications 20X. Scale bar represents 0.5mm.

