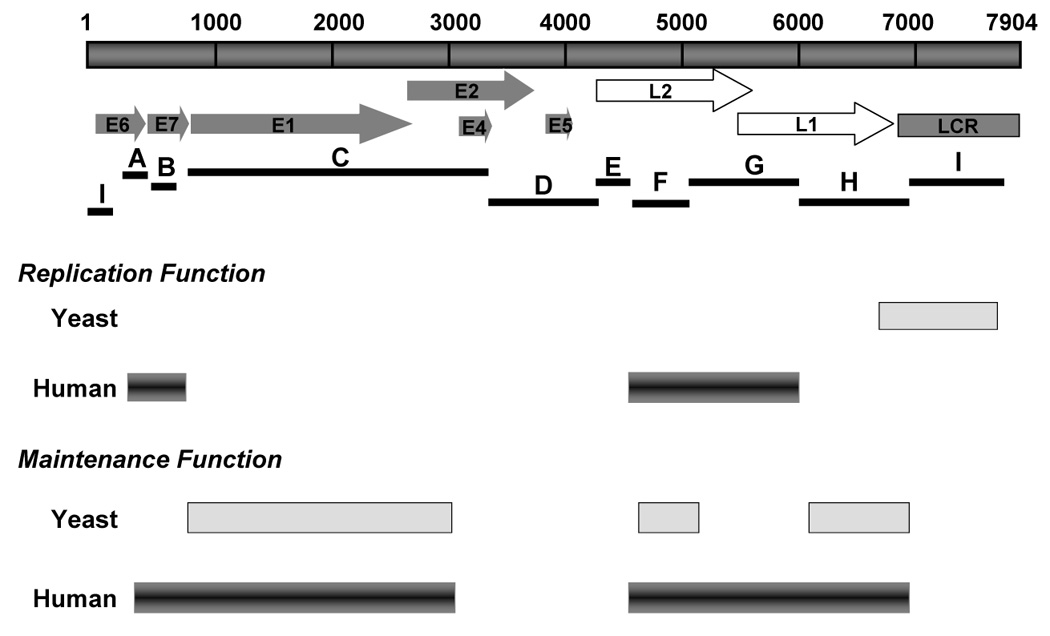
FIGURE 6. Comparison of replication and maintenance elements mapped in yeast and human cells.

The replication and maintenance elements mapped in yeast are shown as light gray bars. The dark beveled bars show significant replication and maintenance functions mapped in human cells in this study.
